Is Your Team Heading Towards Technical Bankruptcy?

 Why do we have lighthouses placed on islands and on the coast?
They serve as a navigational aid for ships. They mark coasts, cliffs, or even dangerous reefs. Places a ship wants to avoid.
Just placing a lighthouse there might be enough for ships sailing during the day, but not for those sailing at night. Ships, especially big ones, are to hard maneuver. If their captains want to change course, they have to do it in time. That's why lighthouses emit light far away so that ships can change their course before it is too late.
What has this to do with software engineering or technical debt?
Software engineering teams are like big ships cruising in the dark. Technical bankruptcy is a cliff that obviously needs to be avoided, but it does not have a lighthouse. How do we know if we are moving away from the cliff, or if we are heading straight towards it? And how close are we to the cliff?
The purpose of this article is to give teams a way to find out: are we on a collision course?
This is an article in my series on technical debt. If you are not yet familiar with the concept, have a look at my introductory article on technical debt.
In an Ideal World
In an ideal world, we would have a nice dashboard showing us our course. It would show how far away we are from the cliff of technical bankruptcy, our direction, and our speed.
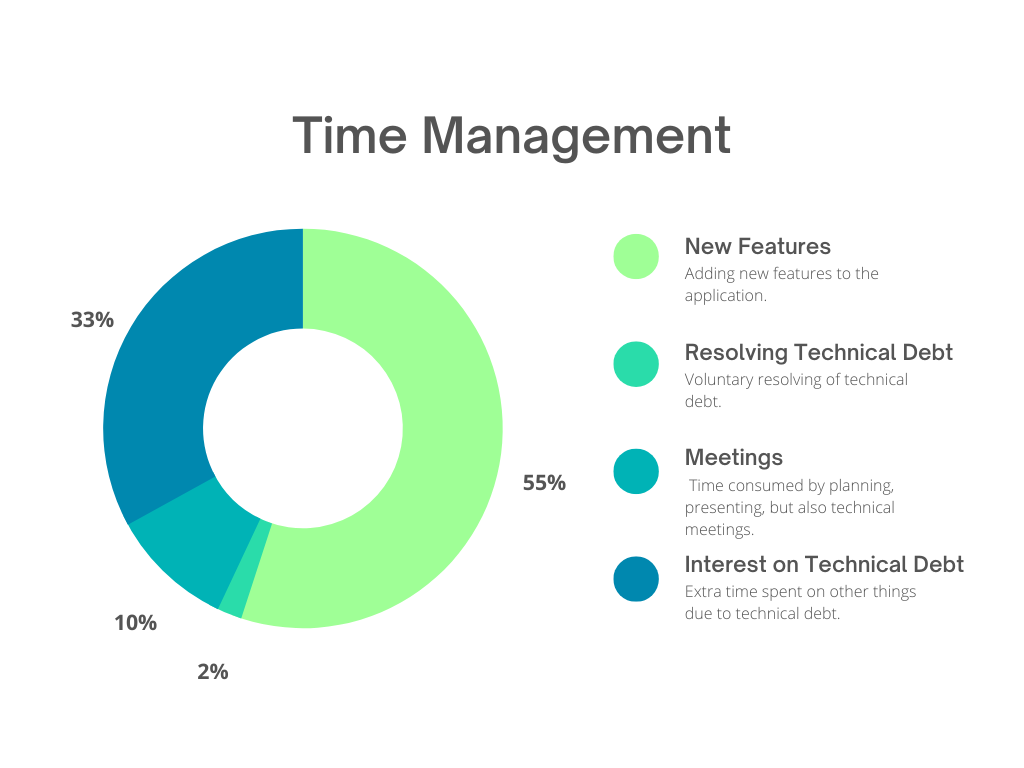
One widget on our dashboard would show us what we spent our time on in a period of time. It would show how close we are to the cliff. In the example graph, we see that 33% of the time is spent on interest payments on technical debt (TD). We also see that 10% is spent on meetings.
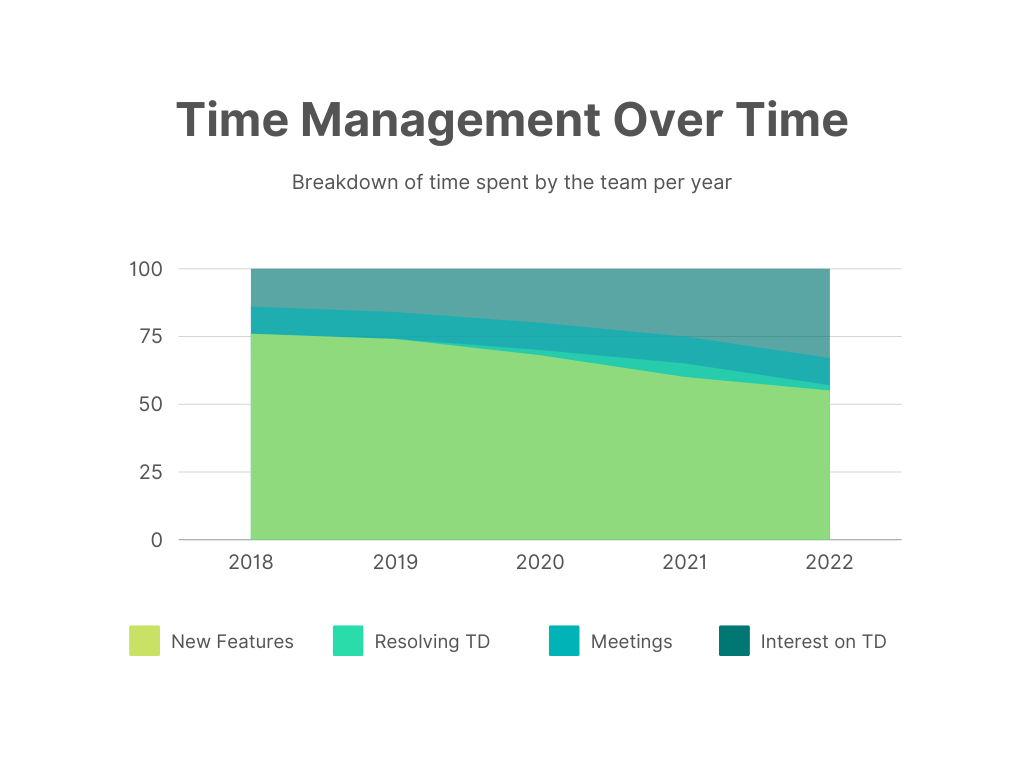
A second widget, like the image above, would show the change of widget 1 over time. It would show the distribution of the team's time and how it changed over the years. This would allow us to see emerging trends concerning technical debt management.
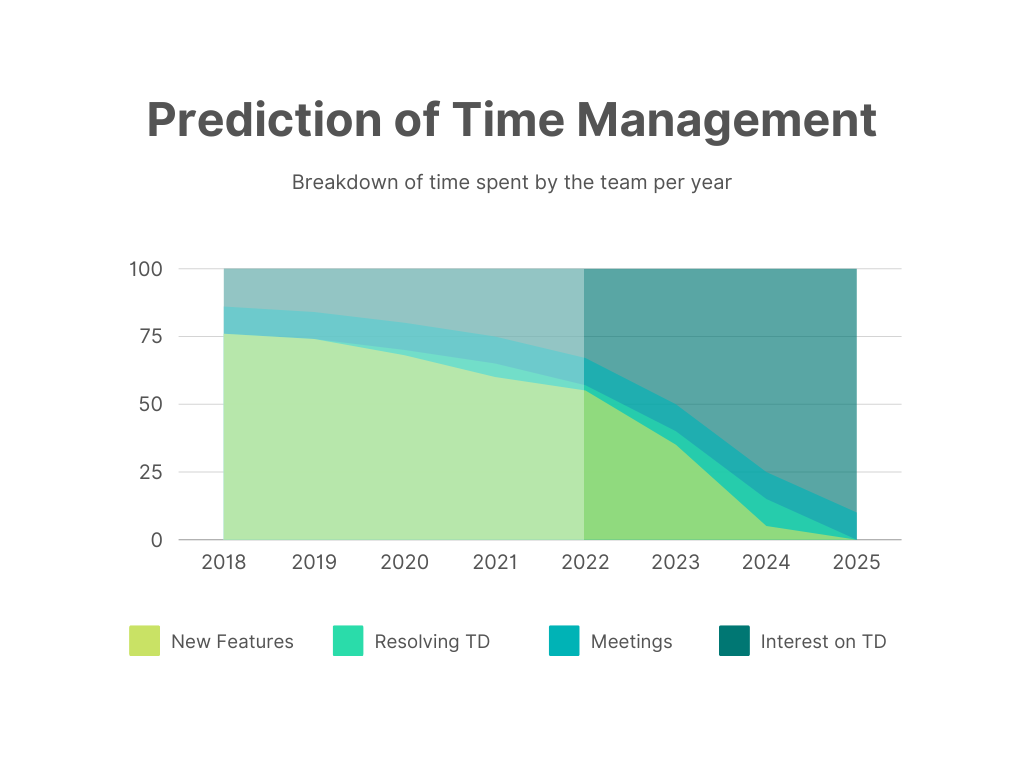
Finally, to finish the dashboard of our ideal world, we have widget number 3. It would extend the graph of widget 2 into the future, showing us the answer to the question:
Are we going technically bankrupt? And if so, when?
In the example above, we would be in three years from now, in 2025.
Back to Reality
Dreaming big is important.
A few decades ago, it would be hard to believe that today we are walking around with immensely powerful computers as phones in our pockets, yet it happened.
So, let's see how close we can come to our ideal technical debt dashboard in reality.
Intermezzo: Technical Economics
The technical debt metaphor hints at a larger analogy between software teams and companies. The scientific community has already been exploring this idea [1][2]. Software teams can use economic principles in their decision making when it comes to time management. One economic/accounting concept is particularly useful for this article: free cash flow (FCF) [3]. $$ FCF = Cash From Operations - InterestPaid - Capital Expenditures $$ The formula above is a simplified economic definition of the money a company can spend freely. It is simply the money coming in minus financial obligations that are to be met: interest payments, salaries for employees, etcetera. $$ FTF = Total Time Of Team - TDInterestPaid - Meetings $$ This new formula embodies the same concept for software teams. FTF stands for Free Time Flow: the time that can be spent freely by the team equals all their hours minus technical debt interest payments minus mandatory meetings.
For example, a team of 5 developers working 40 hours per week may spend 5 x 4 hours per week on meetings and 5 x 8 hours on fixing bugs, giving a free time flow of 5 x 40 = 200 - 20 - 40 = 140 hours per week.
A team is technically bankrupt if their FTF is 0 and cannot be made positive again.
"Cannot be made positive again"?
It is not very uncommon for a team to have zero FTF for a week, but that does not make them technically bankrupt. A classical example would be a team with scheduled releases every 3 months. During those 3 months, their FTF will be relatively high. Right after their release, however, it is likely to become zero for a short period of time.
Why?
A large amount of new code is deployed at once, raising all bugs in it at once as well. This will make the FTF dip temporarily, but once the bugs are fixed the team should go back to a positive FTF.
The Steps towards Monitoring your Course
In the following sections, I will set out a lightweight process for a software engineering team to get a grip on their course with respect to technical debt.
Step 1: Doing our Bureaucratic Duty
Widget 1 showed us what a team was spending its time on. Although this is hard to monitor precisely, estimating it is very doable. The bad news is it involves my least favorite activity of my job: keeping track of my hours.
So let us keep this as simple as possible.
During the day, a developer should keep track of how much time went into each activity:
- Meetings
- Building new features
- Paying interest on technical debt
- Resolving technical debt
For meetings, this is rather easy. Distinguishing between working on a new feature and on resolving technical debt should also be doable. The difference between paying interest and resolving technical debt is more subtle.
When am I paying interest?
As a rule of thumb, I would say: when you are involuntarily resolving technical debt, you are paying interest. Dropping your current story to immediately fix a production incident? Paying interest. Having to change dozens of instances of the same magic string to a new value? Also paying interest. The challenging cases to classify arise as crossroads during regular stories. You come across some below-par code that works fine but is far from perfect. Again here, ask yourself: is it mandatory I refactor this in order to complete my story, or is there a way around it? If there is a way around it, you are voluntarily resolving technical debt. If not, you are paying interest.
Note: Fixing a bug on production is counted as interest paid, but typically leads to resolving technical debt as well. The key is that you are obligated to spend time on it and it thus reduces our FTF.
Tracking time in practice
There are different ways to track time as a developer. You could use a simple Excel sheet, but that would require you to count the time yourself. Preferably, I could track time in a fashion similar to a chess clock, by simply hitting a button. That way, tracking time is a swift action and does not require a context switch from my actual programming.
Personally, I have been using Clockify as it is free and rather simple to use.
A typical week might look like this:
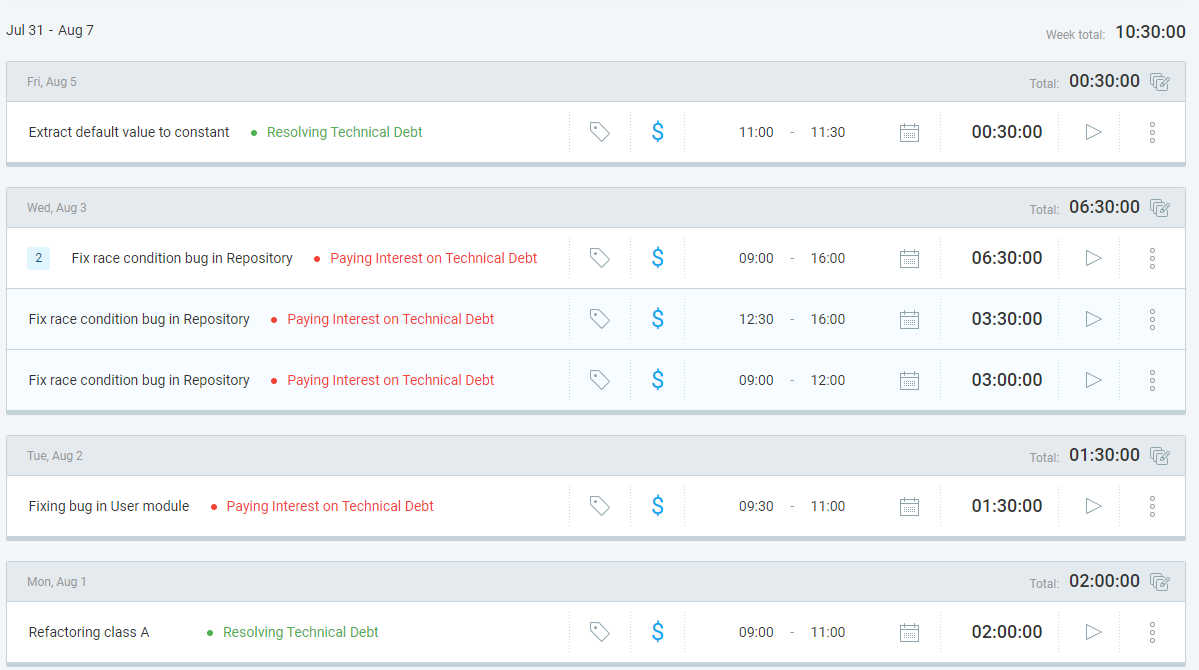
Note that I did not track meetings or time spent on new features in this example. I would recommend only tracking non-regular meetings (if stand-ups, refinements, etcetera always take the same amount of time per week there is no need to explicitly track it every week) and treating working on new features as "the rest" of your time: time spent on it can be inferred from knowing the other three. All this makes it less cumbersome to track hours.
Step 2: Building the Dashboard
Once you (and your team) have gathered some time-tracking data, you can start building the dashboard. I started by using Google spreadsheets for this, which is free and easy to use. Set up your data (categorized by activity and the hours spent on it per week) and create a stacked bar diagram from it:
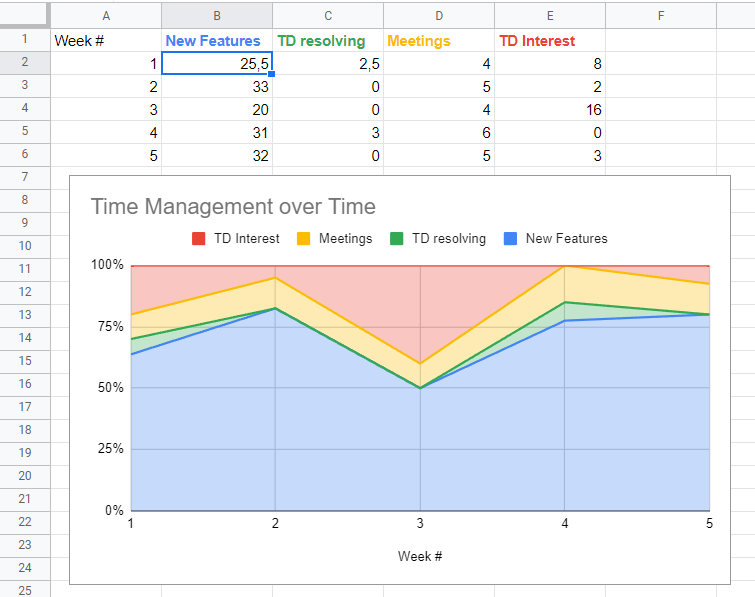
Boom! We now have a nice visual overview of where your team is spending its time on and how this distribution is evolving.
Step 3: Finding our Course
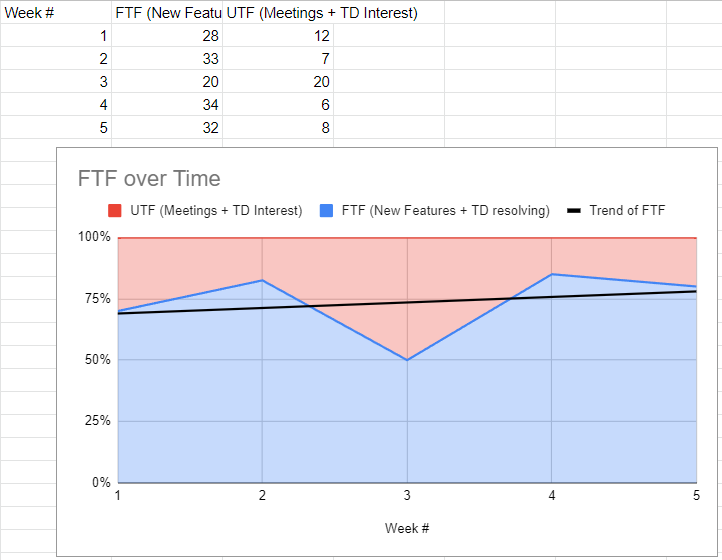
Now it's time for the most interesting step: determining whether we are heading towards technical bankruptcy. This can be estimated with the data we have gathered. Start by creating two metrics, derived from the four time categories we have. $$ TotalTimeOfTeam = NewFeatures + TDResolving + TDInterest + Meetings $$ The first metric we derive is FTF, based on the definition given earlier in the article. $$ FTF = TotalTimeOfTeam - TDInterest - Meetings $$ $$ FTF = NewFeatures + TDResolving $$ The second metric is UTF (Unavailable Time Flow): $$ UTF = Meetings + TDInterest $$ UTF captures time we are obligated to spend on activities and that we thus cannot use for new features and resolving technical debt. The sum of UTF and FTF equals the total time of the team: $$ TotalTimeOfTeam = FTF + UTF $$
We can generate a new stacked bar chart from these two metrics, but moreover: we can generate a trendline for FTF. If the trend increases or stays flat, we are doing a good job. If the trend in FTF is negative, we are heading towards technical bankruptcy. Below is an example with a positive trend that follows from the example data that I used up till now.
Step 4: Improving the Process
The process I set out can be considered an MVP: a Minimum Viable Process if you will. I choose this process because it takes little effort to setup and it takes little time to execute and see results.
That does not mean this process is perfect.
Teams should treat this process like any other process and should always be looking for ways of improving it to suit their personal way of working. One such improvement could be automating the process. Building a dashboard that automatically generates the desired diagrams is very doable and saves time compared to manually generating the diagrams.
Conclusion
Software engineering teams exist to build systems, but are held back in velocity by having to spend time on technical debt. If a team cannot keep up with the problems arising from their codebase, they will never have time to build new features and are technically bankrupt.
What we actually want to measure is FTF: Free Time Flow, a concept borrowed from economics and accounting. FTF is the time a team can freely spend, either on new features or on voluntarily refactoring code.
Software engineering teams are often in the dark when it comes to their FTF.
Is their team heading towards technical bankruptcy or not?
It is time to give them light and to let them find out.
In this article, I explained a simple process. It involves very basic time tracking of four activities: new features, technical debt resolving, technical debt interest, and meetings.
This data allows you to find out how much time your team is spending on technical debt and whether this is increasing over time. In other words: whether you are heading towards technical bankruptcy.
Using this process, software engineers have a lighthouse showing them whether to start changing course or to keep cruising as they are.
Final Words
I hope you found this article helpful and I hope I convinced you to give the process a try. If you have feedback on it or have a different process already in place please share your thoughts in the comments or contact me on LinkedIn.


